4 Fundraising Metrics Powering Workplace & Corporate Giving
Corporate giving hit a record $44.4 billion in 2024, up 9.1% over the prior year [1]. Companies are ready to match gifts, fund volunteer hours, and write sponsorship checks. The hard part is knowing where to aim. Employer giving is rarely measured the way the rest of your fundraising metrics are, so it stays a someday project, always losing out to work that feels more “trackable.”
That’s the gap the 2026 Virtuous Nonprofit Benchmark Report fills. Based on data from mid-sized and large nonprofits across the US, it presents several core findings that map directly onto employee-led philanthropy, which we’re going to cover here. These insights show you where your corporate giving operations are thriving and where they’re currently leaking, and each metric section below follows the same basic path:
- What the data says
- What it means for your programs
- And the move to make next
But before we dive in, let’s quickly cover some definitions.
- Corporate giving is the broad world of company support: sponsorships, grants, volunteer grants, matching gifts, and direct donations.
- Workplace giving is a specific subset of corporate giving that includes matching gifts, payroll giving, volunteer incentives, annual giving campaigns, and other employer-led programs that connect corporate team members with nonprofit causes like yours.
Why does this distinction matter? Workplace giving is often the front door. A donor who starts with a payroll deduction may later trigger an employer match, get featured in a company giving campaign, or advocate for a broader sponsorship. As direct corporate grants become less and less predictable, nonprofits are looking to employee giving as an increasingly reliable funding stream [2].
Metric 1: Portfolio Balance (A Corporate Giving Lens)
What the Data Says
According to investment strategy resources, a portfolio balance is defined as “combining different asset classes like stocks, bonds, cash, real estate, and commodities to achieve a desired level of risk and growth through resource diversification.”
In the fundraising world, it means ensuring a strategic mix of small-dollar givers, major individual contributors, corporate partners, foundation and government grants, and more to insulate your organization against market shifts and secure long-term operational resilience.
In other words, a balanced portfolio shows where your revenue actually comes from, sorted by donor tier:
- General donors (under $1K a year)
- Mid-level donors ($1K to $9,999)
- Major donors ($10K and up)
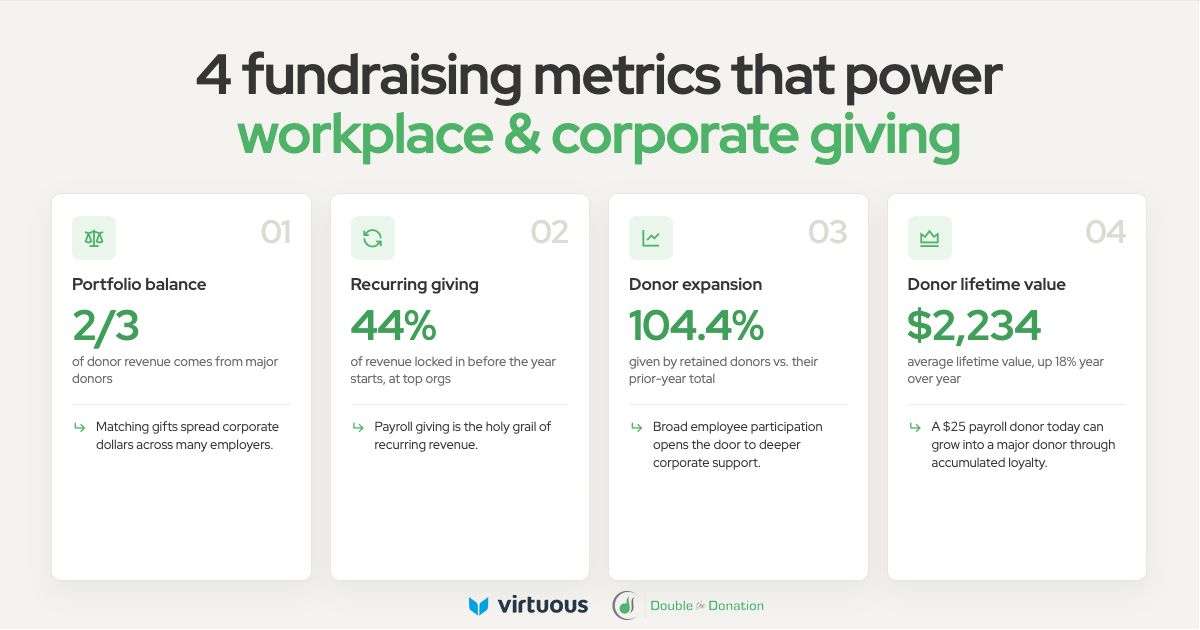
The Virtuous benchmark report found that, across organizations, two-thirds of all revenue came from major gifts. That concentration is a strength when those relationships are healthy and a liability the moment one of them moves.
What It Means for Corporate Giving
A diversified funding base is one of the core benefits of corporate giving, and concentration risk is exactly what it guards against. The trouble is that concentration can hide inside a corporate program that looks healthy on the surface. A development director might tell you their corporate revenue is diversified because they have six corporate partners. Look more closely, and just two of those partners account for the vast majority of their support, which amounts to another form of concentration.
The benchmark report put real numbers to what happens when such a concentration breaks down. In it, we see that education-sector organizations were the only group whose retained donors gave less than the year before. The cause? It wasn’t broad disengagement. It was a small number of unusually large gifts from prior years that simply didn’t repeat. When a handful of relationships carry the revenue, one of them stepping back shows up across your entire picture.
This is where workplace giving truly delivers. Matching gifts, payroll deductions, and volunteer grants spread your corporate dollars across many employers rather than a few headline partnerships, and that breadth is what keeps the base steady.
Your Move
Treat your corporate revenue the way you’d treat your overall donor file. Once you see how much of your corporate revenue rides on your top few partners, you know exactly where you’re exposed. From there, be sure to:
- Track corporate revenue by tier, not by partner name. A list of partners hides concentration. A breakdown by dollars reveals it.
- Build a mid-level corporate pipeline. Target more companies in the $1K to $10K range, so a single major partner doesn’t swing your year.
- Lean on employee giving to broaden the base. Matching gift revenue (along with volunteer grants and payroll gifts) comes from wherever your donors work. This spreads corporate dollars across many entities and lowers your dependence on any single partnership.
By intentionally diversifying your corporate revenue, you effectively insulate your nonprofit against corporate budget cuts or shifts in CSR priorities. Taking such a strategic approach ensures that your organization maintains fiscal stability and preserves a reliable network of corporate partners.
Metric 2: Recurring Giving (A Workplace Giving Lens)
What the Data Says
Recurring giving measures the share of your revenue from donors who give on a regular, ongoing basis. The Nonprofit Benchmark Report calculated an organization’s percentage of recurring funds as the sum of gifts from recurring payment plans and gifts from donors who gave 6 to 12 times in the year, divided by total revenue. The sector average came in at 20.96%.
Top-quartile organizations hit 44%, meaning nearly half of their annual revenue was locked in before the year even started. That kind of predictability changes how a team budgets, plans, and breathes. It matters even more given the broader trend: the Fundraising Effectiveness Project found that more dollars were being raised from fewer donors, with the smallest tier donors ($1 to $100) dropping by more than 11% year over year [3].
When your everyday donor base is eroding, locked-in recurring revenue is what holds the floor.
What It Means for Workplace Giving
Workplace giving, as an umbrella term, includes payroll giving, an employer-supported giving program that automatically deducts a set donation amount from employees’ paychecks over time. That’s why Double the Donation calls it “the holy grail of recurring revenue.”
A payroll deduction is recurring by design. It lands in the same bucket as a monthly online gift and carries the same compounding advantages: steadier retention, more frequent touchpoints, and greater value per donor. It also produces frequency automatically. Once an employee opts in, the gift repeats every pay period without a renewed ask, which changes where they sit in your file, their likelihood of lapsing, and what they’re worth over a five-year period.
There’s a structural reason for that resilience. Most monthly giving programs lose donors to expired cards, re-enrollment friction, and more. A payroll deduction continues until the employee actively opts out, so it holds donors longer, making it one of the most durable recurring revenue streams.
Your Move
Find out where this revenue lives (and whether you’re counting it correctly) in your CRM. There are a few key questions to answer here:
- What share of your recurring revenue comes through employers versus direct monthly giving?
- How does retention for employer-channel donors compare to your overall donor retention rate? (It’s usually higher.)
- Are these donors tagged as recurring, or sitting in a separate silo where their lifetime value never gets totaled?
Keep in mind that, due to corporate disbursement structures, payroll-facilitated gifts can be harder to track and credit than direct donations, so establishing a dedicated system is worth real attention.
Metric 3: Donor Expansion (One Metric, Two Playbooks)
What the Data Says
Donor expansion measures whether your retained donors gave more or less than they did the year before:
- Above 100% means they grew.
- Below 100% means they shrank.
The recent benchmark put overall expansion at 104.4% (meaning overall donors gave slightly more than the previous year), with mid-sized organizations leading at 114%. The headline finding: retained donors are giving more, even though overall retention stayed flat.
Depth, not breadth.
The sector-specific picture is a useful warning, too. Human services and faith-based organizations both posted strong expansion at around 110%, with retained donors giving more year over year. On the other hand, education dropped to 68.09%, dragged down by a few outsized gifts that didn’t repeat.
That single number is the clearest argument for why concentration and expansion are linked. When most of your revenue rides on a small group, expansion stops measuring donor enthusiasm and starts measuring whether your biggest checks have renewed.
What It Means for Workplace + Corporate Giving
Expansion shows up differently across the employer-giving system. Workplace giving grows by adding participants. Corporate partnerships grow by deepening commitment. And it’s worth noting that success in the first realm often leads to the second.
Workplace Giving: Increasing Participation
The per-employee gift may never change. What grows is the number of employees enrolled in a company’s program. Move an employer from a thin slice of its workforce to a larger one, and your recurring revenue associated with that company climbs even if nobody increases their individual gift.
The lever is awareness and ease, not ask size. Matching gift programs are among the strongest accelerants because a match stretches an employee’s contribution and gives a hesitant participant a reason to sign up now.
Corporate Giving: Growing Commitment
Broad employee participation is also what opens the door to deeper corporate support. Once a company sees its staff are engaged with your mission, a bigger conversation becomes possible: a dedicated volunteer workday, a featured giving campaign, or an event sponsorship.
A corporate partner has a ceiling like any donor, and you can raise it the same way: track the relationship, report on impact, connect the right people. A one-time sponsor becomes a multi-year partner when someone moves the relationship forward rather than waiting for the renewal. If a company’s size or matching activity suggests room for more, go ask for it!
Your Move
- In terms of workplace giving, strategically leverage social proof to encourage greater program adoption. Peer behavior drives enrollment more than almost anything else, so getting existing matching gift donors or volunteers to invite their coworkers to get involved can go a long way. When people see that a significant portion of their workforce is already involved, they’ll be far more likely to join.
- In terms of corporate giving, build milestone outreach into your partnership management workflow. A six-month impact report, a site visit, or a board-to-board introduction can turn a one-off sponsorship into a multi-year commitment. The same donor expansion strategies you use for individuals also work well for institutions. Try sending a thank-you video or spotlighting a success story on your social media pages!
By embedding such milestones and peer-driven touchpoints directly into your stewardship cycle, you can shift workplace giving from a transaction to an institutional relationship. Treating corporate partners and their employee networks with the same intentionality as other major donors ensures a steadily expanding community impact footprint that grows more robust with each passing year.
Metric 4: Lifetime Value (The Long Game)
What the Data Says
Donor lifetime value (LTV) estimates the total revenue a donor will contribute across their full relationship with you. According to the Virtuous Nonprofit Benchmark Report, built on a five-year, cohort-based model that factors in average gift, gift frequency, retention, and year-over-year growth, average lifetime value grew nearly 18% year over year. The estimation? $2,234.
This growth didn’t come from any single metric spiking. Retention held, frequency rose, and gift size climbed. Small gains in each, repeated across five years, add up to a much bigger number at the end.
However, there’s one caveat to reading LTV in isolation: a high number isn’t always healthy. An LTV built on a few major donors is fragile. The same number built on a wide, recurring base is durable (see: portfolio balance above).
That difference is exactly where employer giving, with its broad base of steady contributors, builds the more resilient kind.
What It Means for Corporate + Workplace Giving
Employer-based giving is a long game, and year-one revenue badly undersells it. The same donor relationship can move from a small payroll gift to a matched donation to a deeper corporate connection over time, and their lifetime value compounds the whole way.
Workplace Giving: Calculating Per-Donor ROI
A $25 payroll donor looks like a rounding error in year one. That’s $300. But that donor doesn’t require re-enrollment, stays longer than a typical monthly donor, and often gives more as their career and salary grow, especially with an employer match doubling each gift. Some eventually become major donors out of sheer accumulated loyalty. Retention is the largest single input to lifetime value, and employer-channel donors tend to stick around longer than almost any other source.
Corporate Giving: Extending Long-Term Engagements
Year one is the expensive year. Legal review, internal approvals, and relationship-building all front-load the cost. However, the return tends to show up in years two and three, when the groundwork is already laid, and the partnership can scale.
The report puts it simply: a donor who gives $100 a year for five years is worth far more than one who gives $500 once. Swap “donor” for “corporate partner,” and the math holds exactly.
Your Move
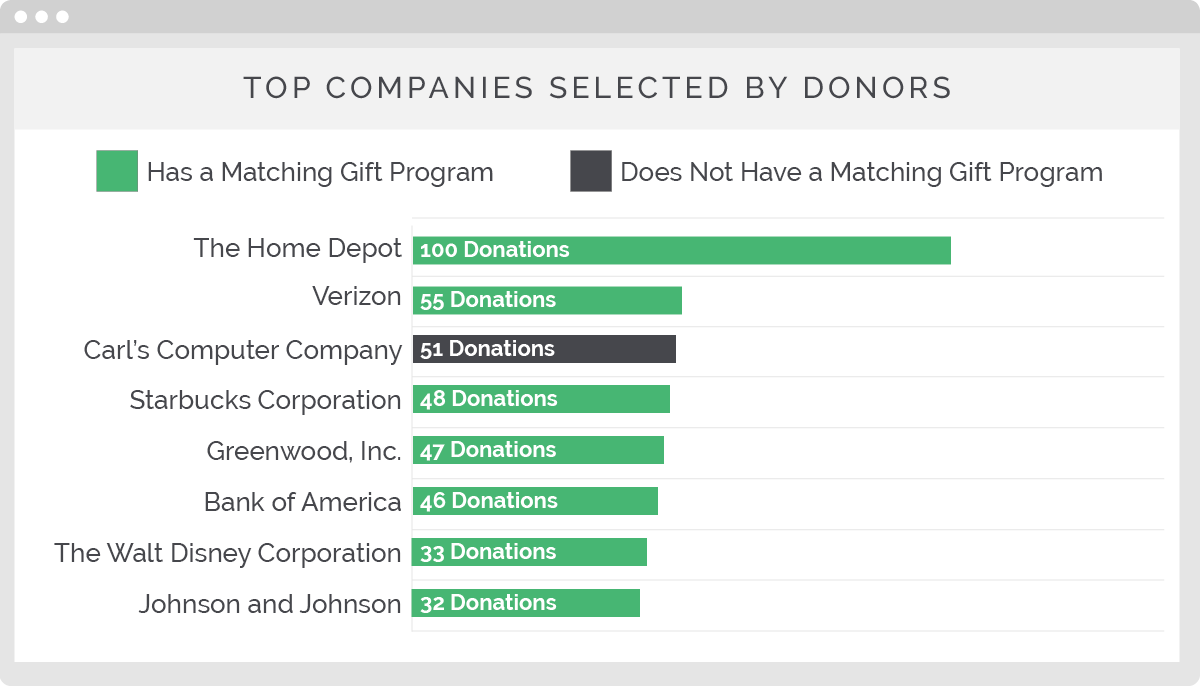
Build a rough five-year model for your most-represented employers and corporate partners (top tip: use Double the Donation’s Top Employers report to pull this information directly from your workplace giving system).
Once you’ve selected your leading prospects, answer the following questions:
- What does 5% annual growth look like, year over year?
- What value would doubling employee participation at this company produce?
- What might expanding into a multi-tiered partnership mean (volunteering, matching, sponsorships, and more)?
Run that math, and the case for investing in stewardship usually looks very different. Track value by segment rather than in aggregate, and you’ll see which relationships are worth deepening and which ones rest on a single check.
Getting Started & Diving Deeper Into the Data
We recommend reading the 2026 Nonprofit Benchmark Report as a map rather than a scorecard. It covers seven key metrics, broken out by sector and revenue band, with specific next steps for each, and its job is to help you find the one or two places where focused effort would have the most impact.
If you’re building workplace giving, start with recurring giving and gift frequency. Find where your employer-channel donors live and whether your CRM counts them as the recurring givers they are. Then push participation within your largest corporate relationships, where the next chunk of revenue is hiding.
If you’re focused on broader corporate partnerships, start with portfolio balance. Pull your top corporate revenue sources and see what share rides on your largest few. If a majority sits with one or two partners, you’ve found your concentration risk and surfaced your first project.
Interested in learning more? Explore the extensive Workplace Giving Resource Library. From blogs and case studies to webinars and podcasts, we offer a wide range of helpful resources for growing corporate support. Explore Double the Donation’s Fundraising Library here →
 This blog post was contributed by Carly Berna.
Carly Berna is the VP of Marketing and Fundraiser-in-Residence at Virtuous, helping nonprofits grow through innovative campaigns and a focus on increasing generosity. With over a decade of experience in marketing, fundraising, and data analysis, Carly has held leadership roles in the nonprofit sector and taught marketing at Pepperdine Graziadio Business School. She also co-hosts the Purpose and Profit Podcast, exploring the intersection of causes and brands.
Cited Research
[1] Giving USA’s 2025 Charitable Giving Report
[2] Philanthropy.com’s What Happened to Big — and Local — Corporate Giving?
[3] AFP Globals’ Fundraising Effectiveness Project Data

