
The Top 6 Corporate Philanthropy Infographics
There’s a good news / bad news situation regarding data on corporate philanthropy.
The good news:
- There is plenty of data out there. At Double the Donation, we’ve even gathered statistics on many aspects of corporate giving over the years and stored it in one easily accessible location.
The bad(ish) news:
- Sometimes you’ll come across so much data that you won’t know which way is up and which way is down, which data is accurate, which less so, which is relevant, which less so. You get the idea.
Well, we’re here to solve that corporate philanthropy conundrum.
Below you’ll find the top 6 corporate philanthropy infographics.
We’ve done the work of sifting through the many in order to highlight an elite few. So without further ado, here they are in no particular order.
Infographic #1: Giving in Numbers Brief
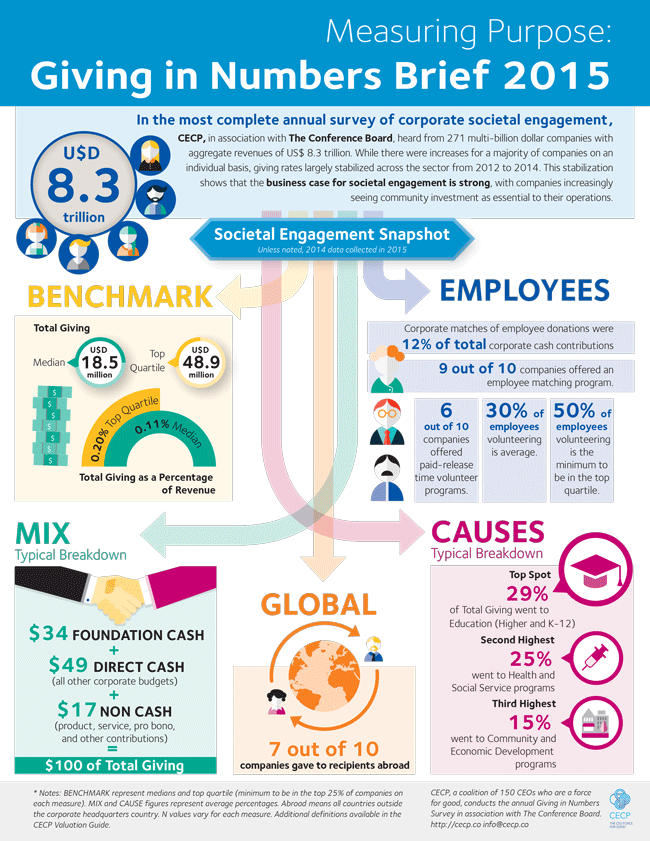
Put together by the CECP, in conjunction with The Conference Board, the Giving in Numbers Brief takes a comprehensive look at trends and statistics in corporate giving. The infographic is filled with data culled from the survey responses of 271 multi-billion dollar companies.
Here are a few highlights:
- 9 out of 10 companies offered a matching gift program
- an average of 30% of employees volunteer
- 29% of corporate giving went to education related causes — a combined percentage from K-12 and higher education
Infographic #2: Top 10 Corporations That Gave Cash to Charity
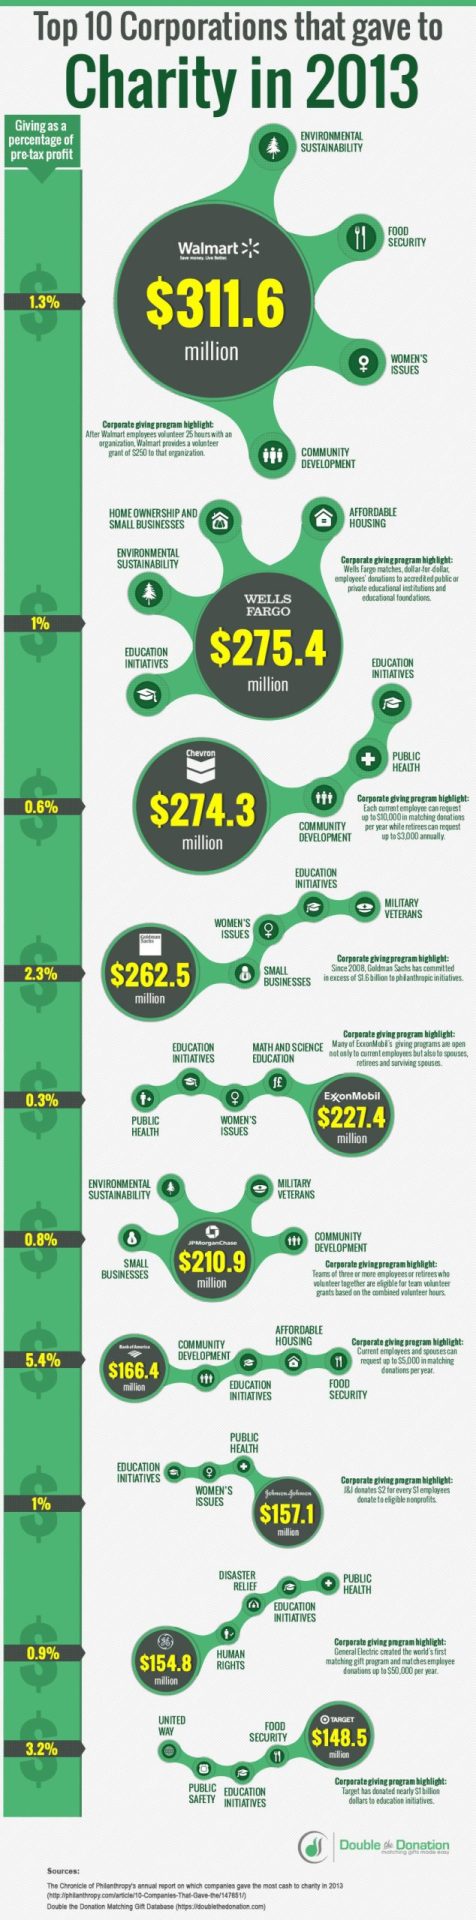
Here at Double the Donation, we thought we’d throw our hat into the ring with an infographic of our own. As its title suggests, this graphic focuses on the ten corporations that gave the most cash to charity in the year the graphic was produced.
Walmart leads the pack with $311.6 million in cash donations. And not too far off the lead, in tenth, was Target with a still very generous $148.5 million. A breakdown of leaders in the philanthropic giving community is a good way to be introduced to the possibilities of these programs and programs like them.
If you’re interested in matching gift programs specifically, check out the top corporate programs.
Either way you slice it, if you’re looking into corporate giving, whether you’re an employee, nonprofit, or company, it is useful to get a sense for the power players in the world of corporate giving.
Infographic #3: BP’s Fabric of America
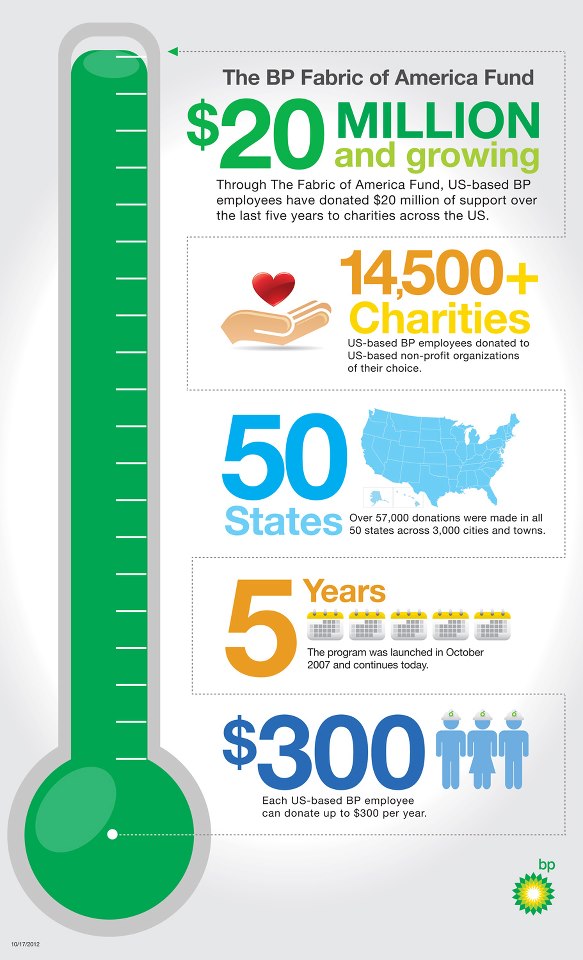
This infographic is a great example of a corporation taking the initiative to outline and highlight its own efforts. Through its Fabric of America Fund, BP will donate $300 to the charity of an employee’s choice.
Learn more about BP’s employee giving programs.
Infographic #4: Meaningful Match-Making by Benevity
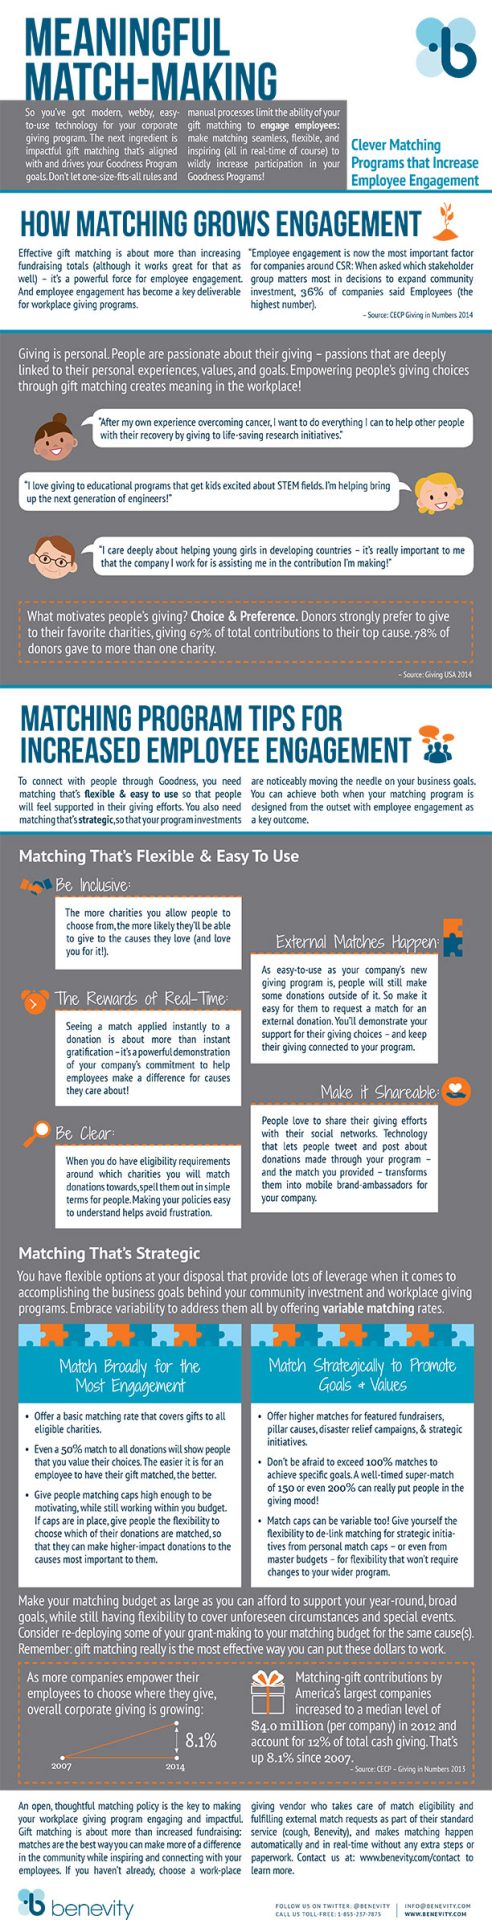
This infographic focuses on how corporations can use matching gift programs to increase employee engagement. It offers tons of valuable and insightful advice.
Here are a few highlights:
- Five tips for increased employee engagement in matching gift programs
- Inclusivity — providing matching gifts for donations to a large range of nonprofits
- Letting external matches occur — accounting for and honoring donations made outside of your company’s matching gift program
- Expediency — make the matches as quickly as possible in order to demonstrate your commitment and dedication to your employees’ nonprofits of interest
- Share-ability — give employees the chance to share the news of their recent gifts and matched gifts
- Clarity — let your employees know exactly what the eligibility requirements are for your program
- Match broadly to appeal to the inclusivity tip, but provide greater incentives for certain causes or nonprofits that your company is specifically interested and invested in helping.
Infographic #5: Corporate Citizenship — A Necessary Investment for Success
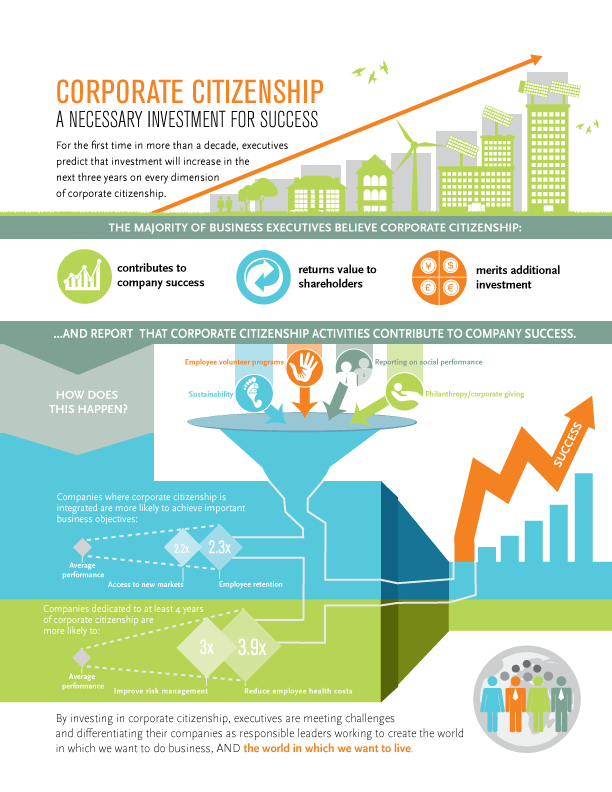
Boston College’s Center for Corporate Citizenship created a helpful infographic regarding the current state of corporate citizenship. The infographic revealed a general upward trend in business investment in corporate citizenship and a rising understanding of the necessity of these programs.
Specifically, the infographic zeroes in on the benefits of corporate citizenship, which it separates into three categories:
- contributing to company success
- returning value to shareholders
- meriting additional investment
Corporate citizenship initiatives, which usually include employee volunteering programs and corporate philanthropic giving as components, are implemented with the idea of businesses serving the communities in which they thrive in, generating a mutually beneficial situation between the company and stakeholders.
Corporate Social Responsibility is a diverse topic to handle. Discover why it’s so important!
Infographic #6: State of Developing Good
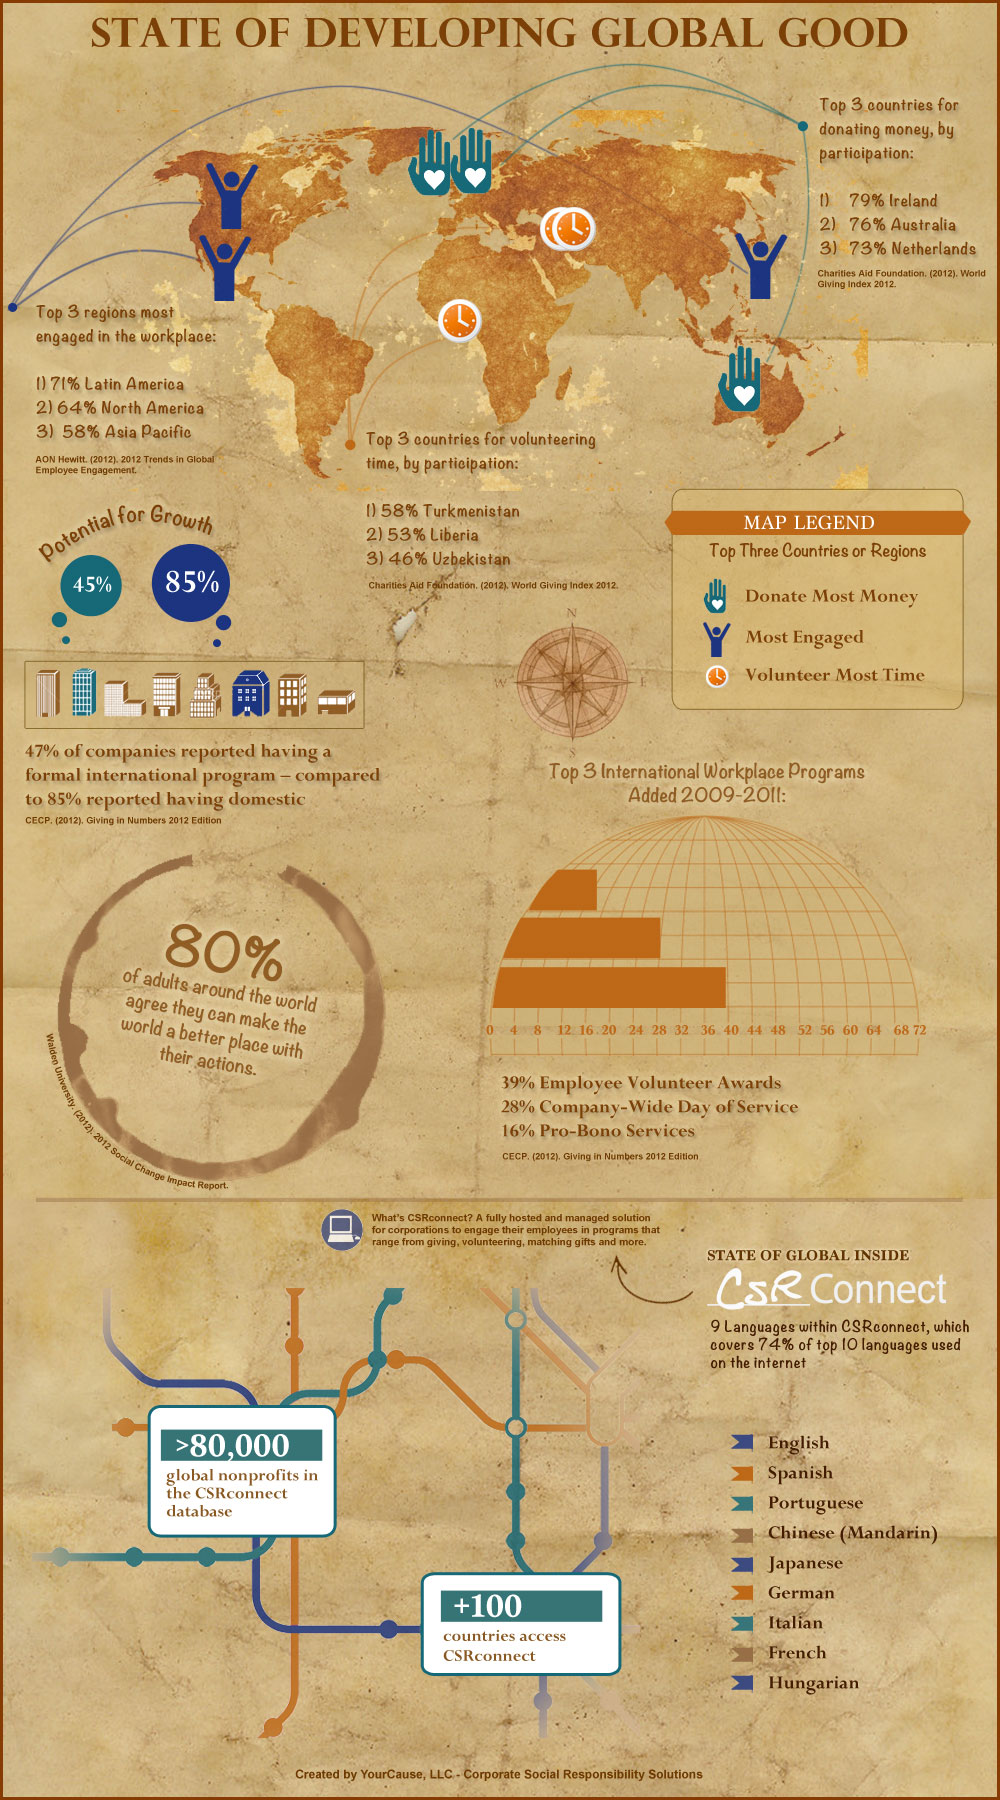
YourCause created this infographic on the state of developing global good as a way of summarizing key international corporate giving statistics.
A couple stats that jump out at us include:
- 80% of adults around the world agree they can make the world a better place with their actions —
- 85% of companies in the US have a formal domestic corporate giving program in place vs. only 45% with a formal international program.
Both represent tremendous opportunities for companies to further their global impact.
These six infographics should more than whet your appetite for data, statistics, and analysis regarding corporate philanthropy. These were all put together with a lot of thought, care, and research. We hope you find the information invaluable to your quest for a greater understanding of corporate giving.


